


Stock and gold models
These are my cycle models for the S&P 500, gold, and US Treasury yields. The working TradingView layouts and reading guides are in the Premium collection below.
S&P 500 Quarter Cent Cycles Theory: Overview
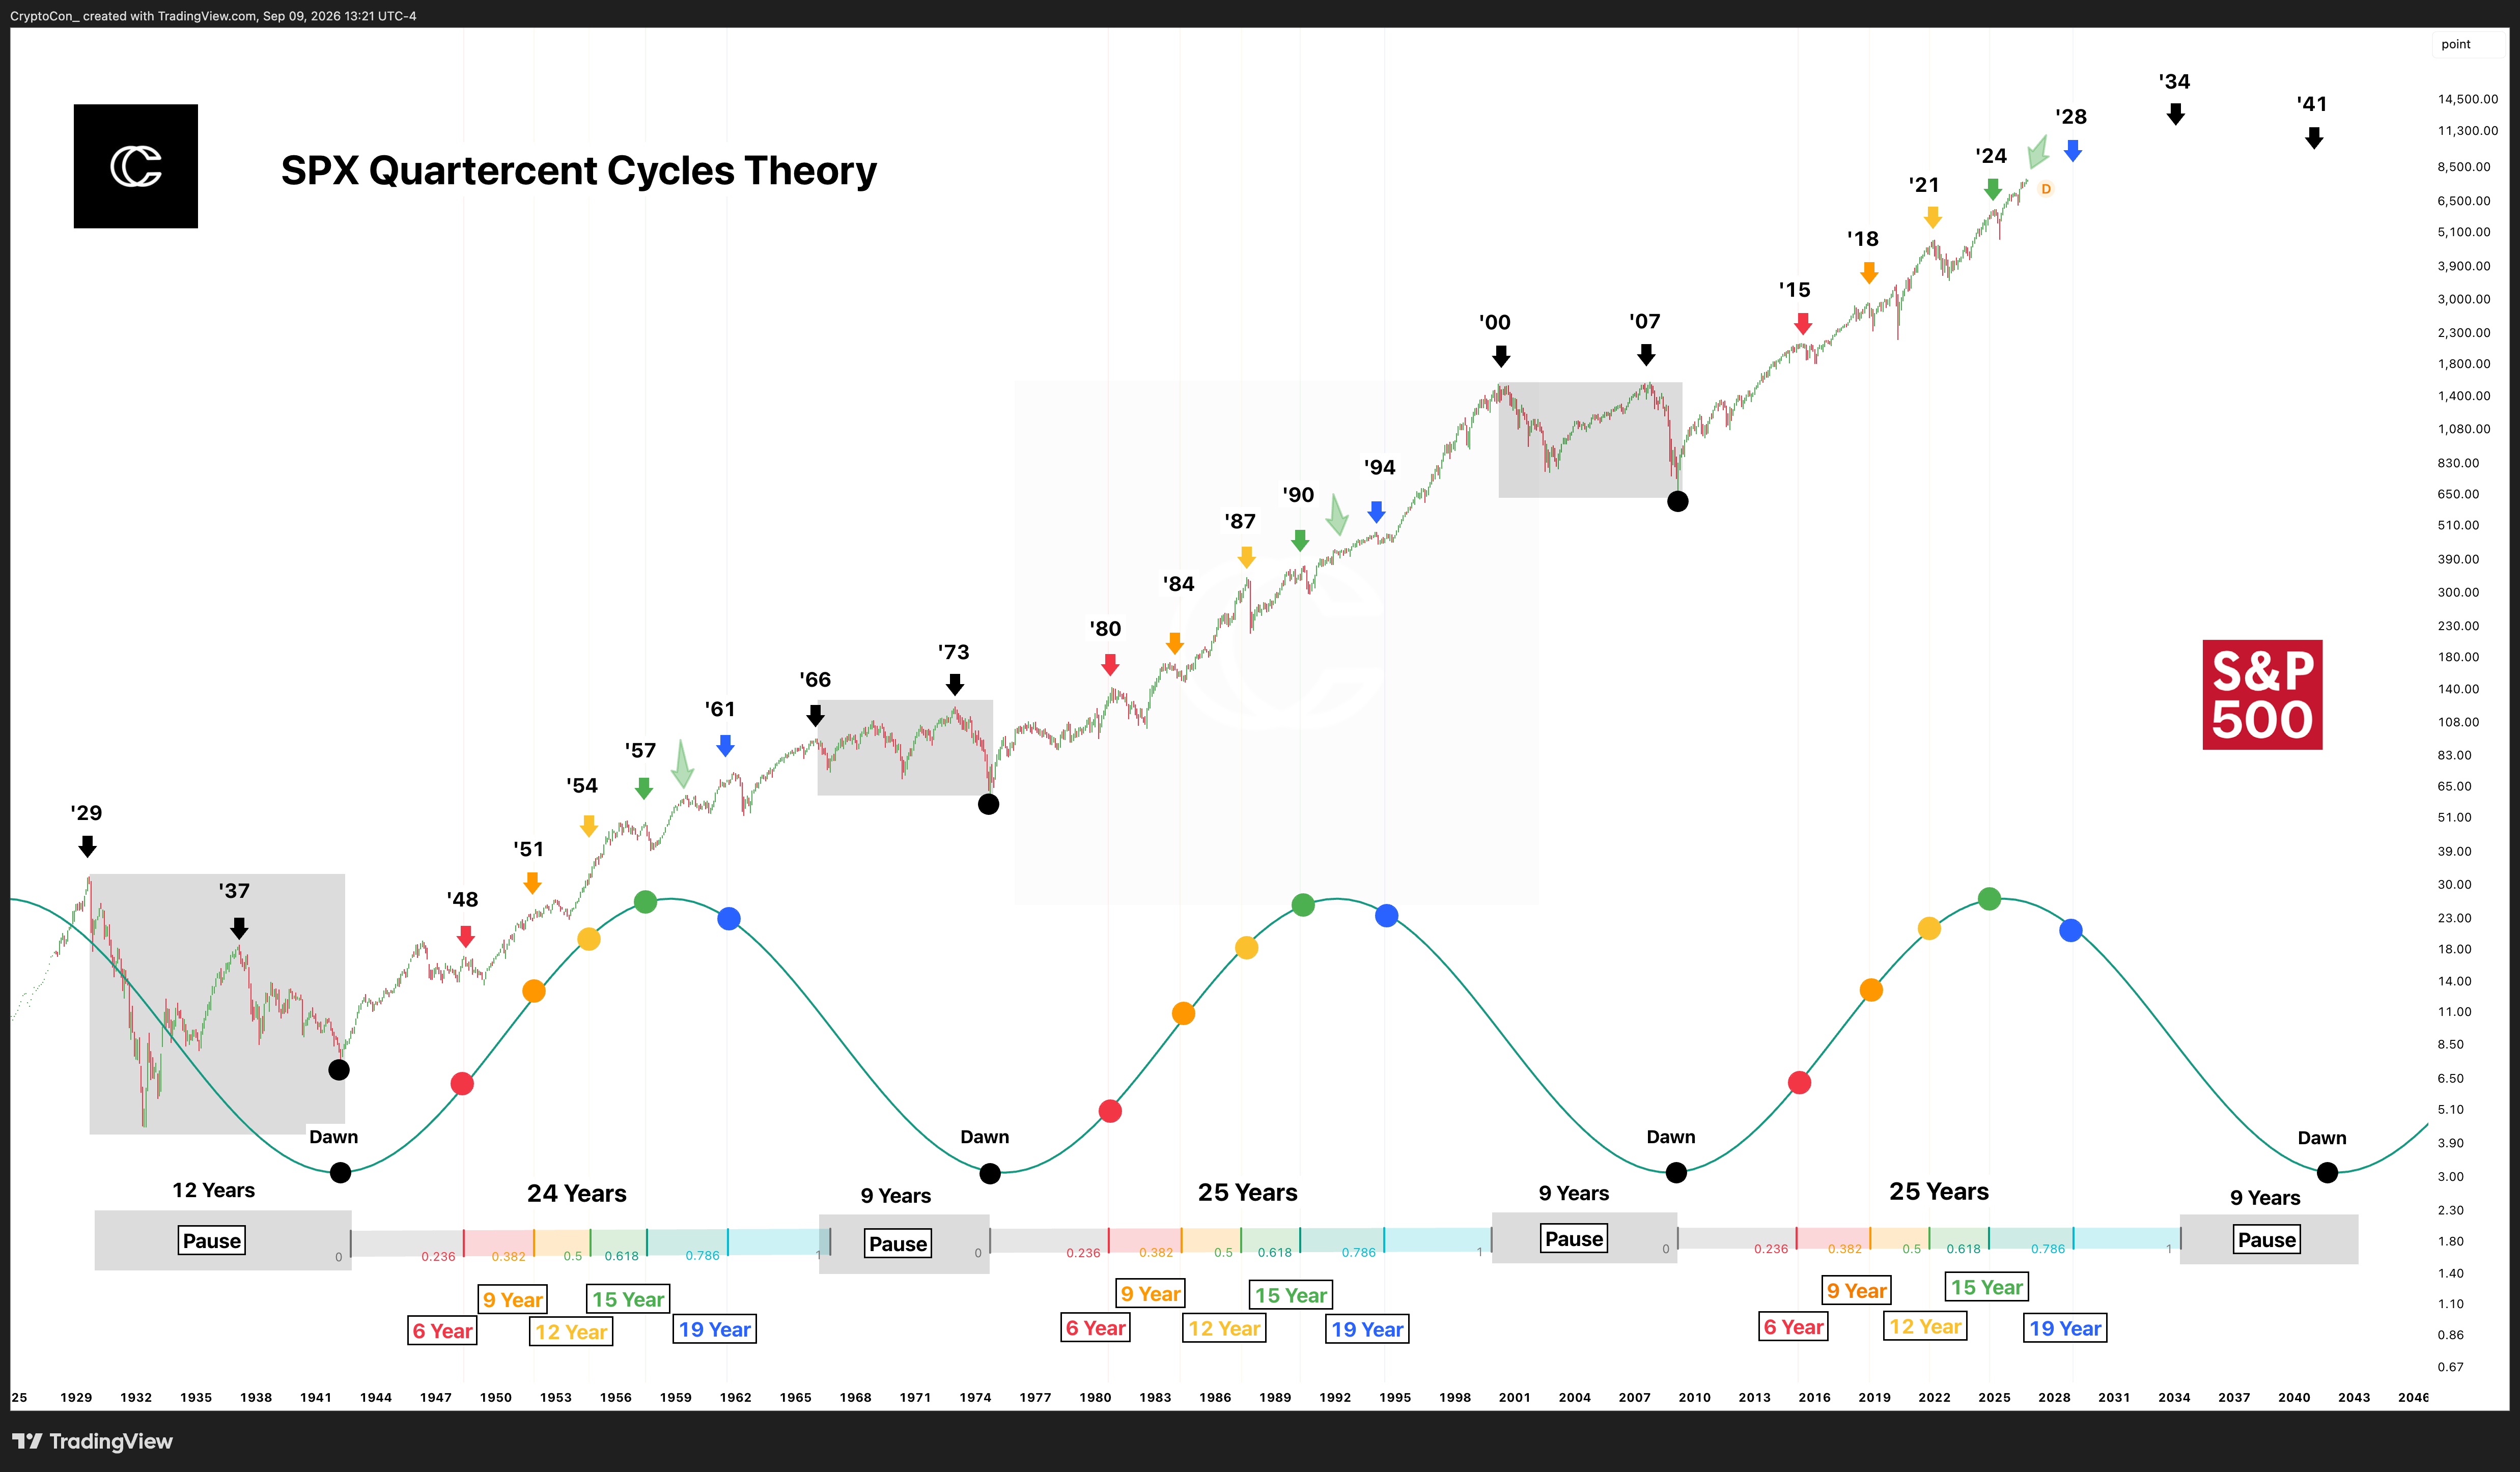
I call this the Quarter Cent Cycles Theory because of the 25 year long cycles in between pauses. I developed it by exploring S&P 500 cycles across the past 100 years.
There have been many periods called recessions, but I see the true market pauses as the Great Depression in the 1930s, the period between 1966 and 1977, and the dot com crash through the 2008 housing market crash.
In between these approximately nine year pauses are five different highs which come at certain intervals after the “dawn.” The dawn is the final and most devastating correction of the pause, which begins the next 25 year run. The highs are listed by how many years they come after the dawn:
6 year top: Red.
9 year top: Orange.
12 year top: Yellow.
15 year top: Green.
19 year top: Blue.
The dates for these tops are further reinforced with Fibonacci time measurements between the dawn and approximately the first top of the pause. Pause periods themselves have two major tops that come about seven years apart.
The exceptions are part of the theory. In 1951 and 1954, price continued up without a correction. The correction associated with the 1984 point came sooner, in 1983. Corresponding highs often act similarly, but they do not all produce the same result.
In my original March 18th, 2025 explanation, I identified December 2024 as the 15 year high, late 2028 as the next topping point to watch, and 2034 to 2043 as the next potential market pause. Those were the projections in that original research; the updated chart and my ongoing research show how the sequence is developing.
Read my original explanation on X
Gold 10/4 Cycles Theory: Overview
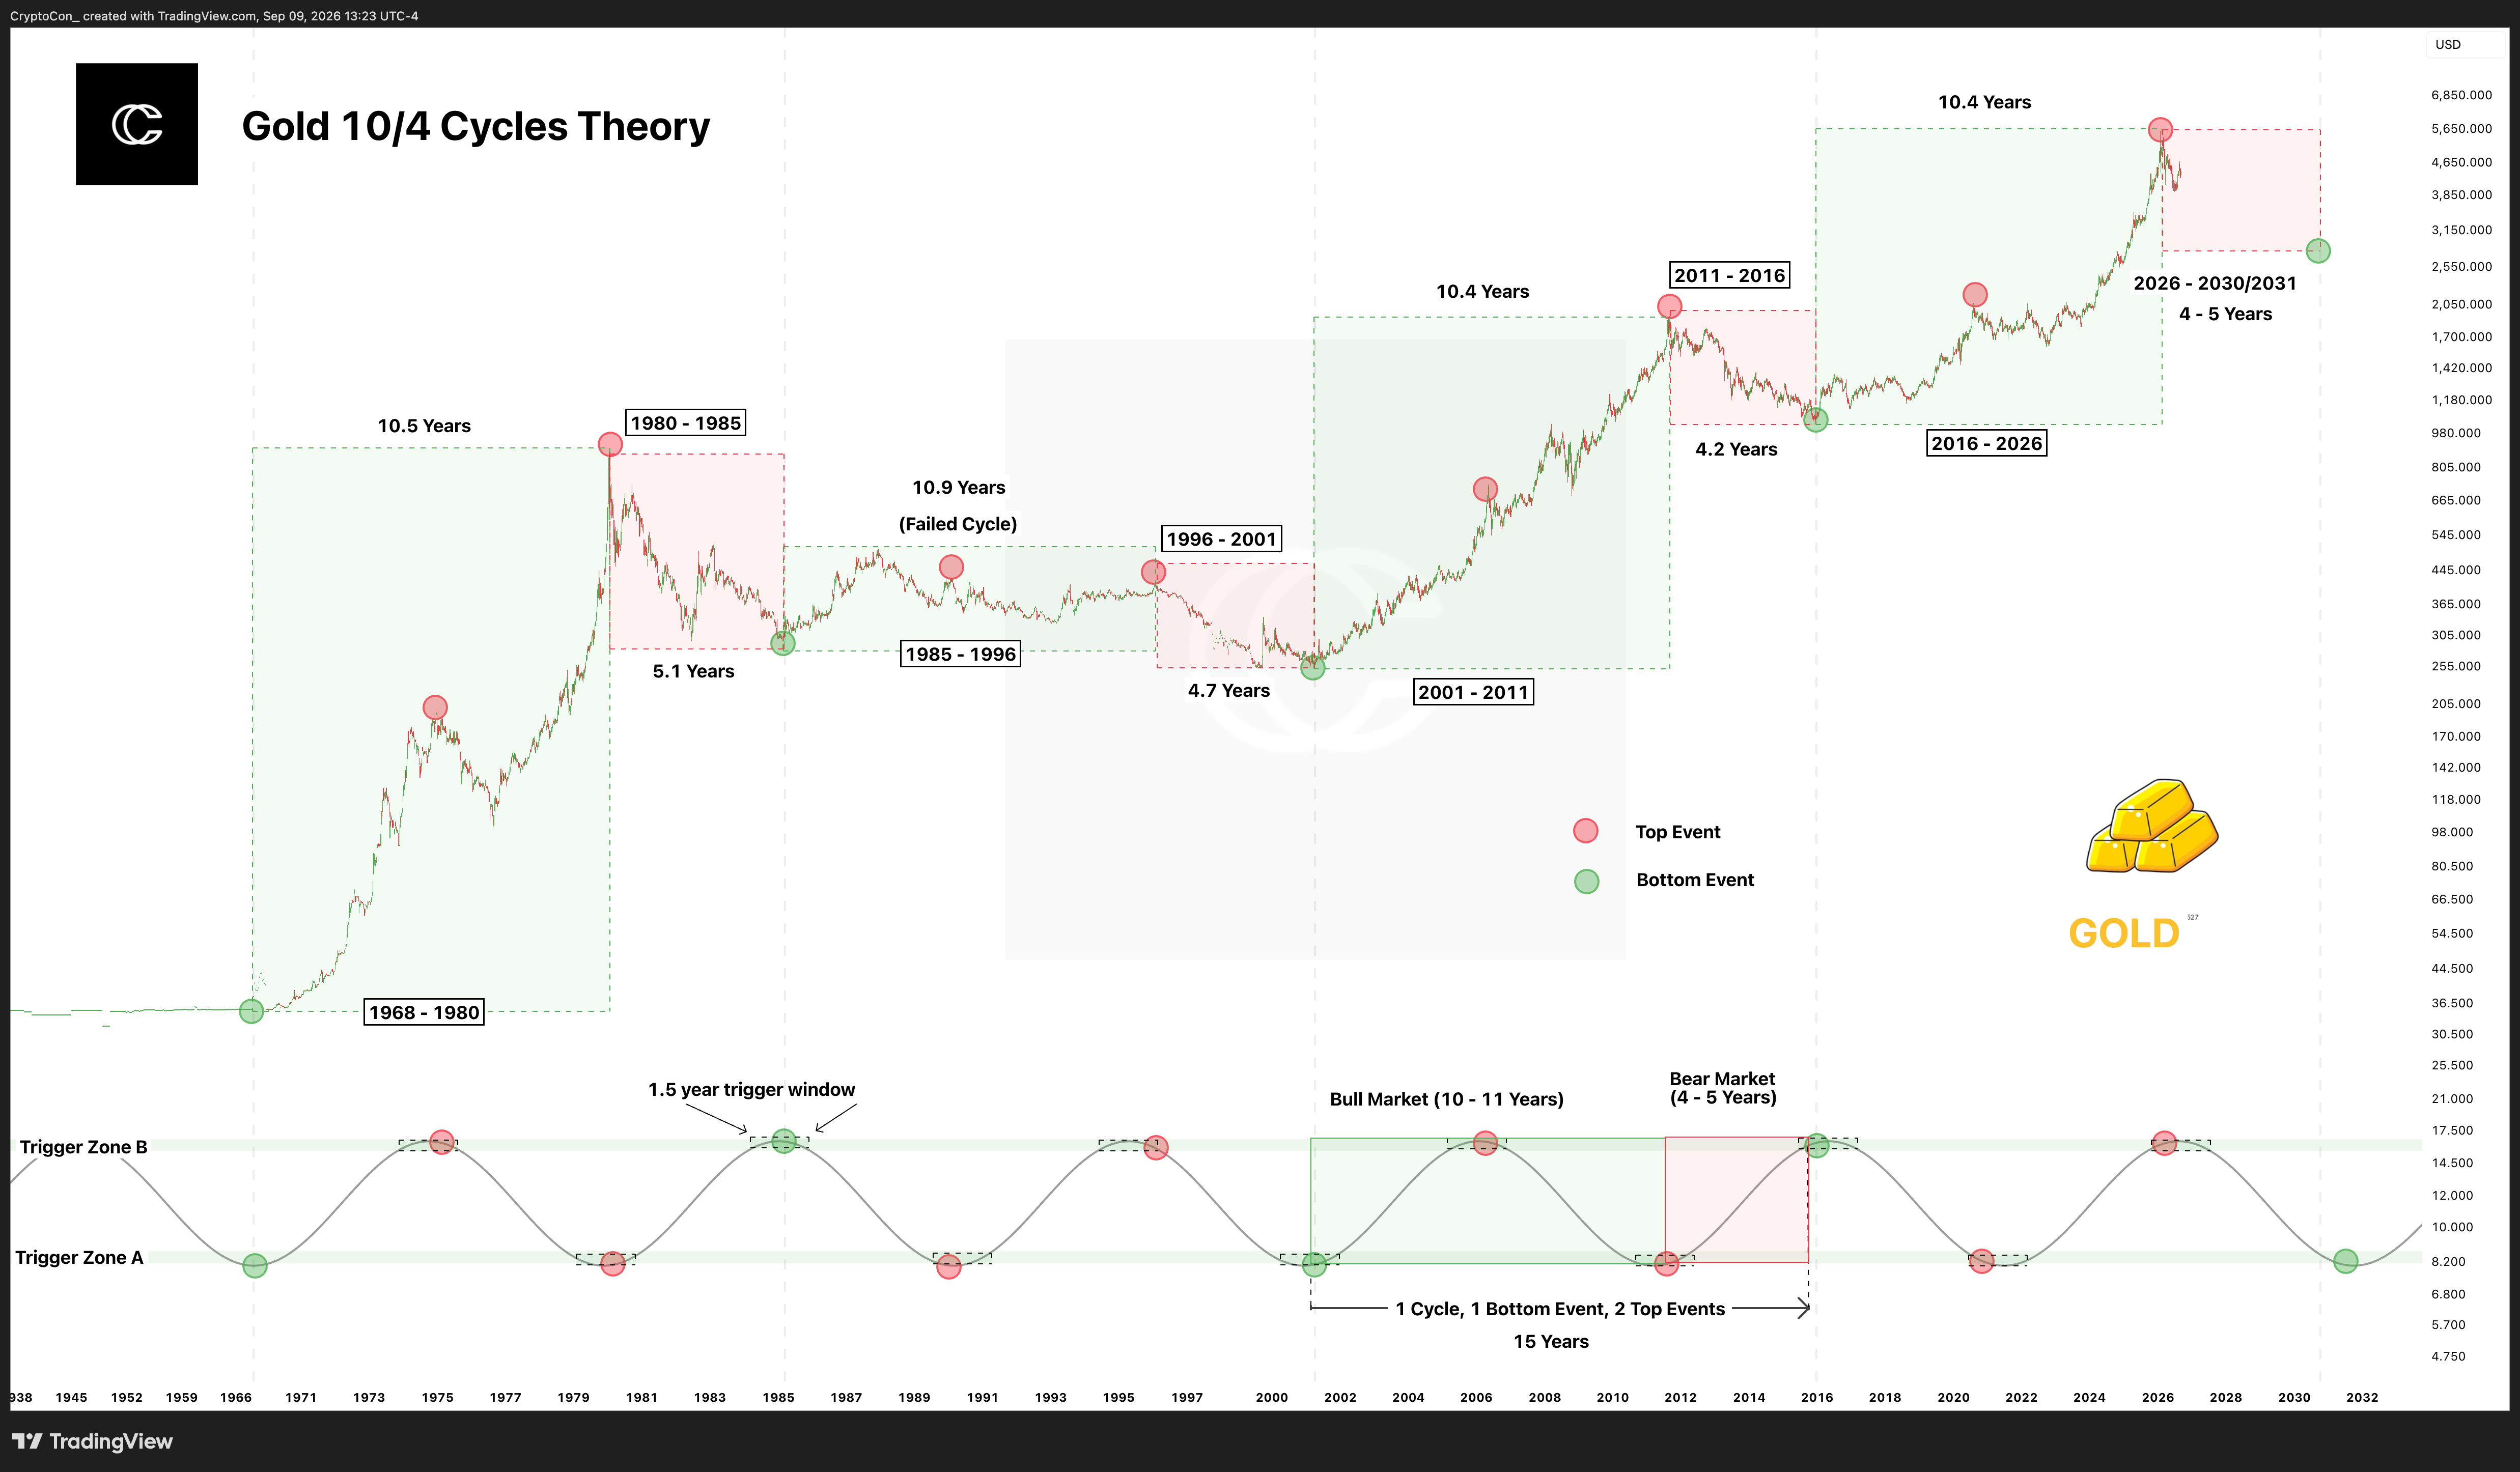
The 10/4 Cycles Theory is my cycles theory for gold. It says that gold operates around a 15 year cycle. The bull market takes 10 to 11 years, while the bear market takes four to five years.
The cycle begins with one bottom event and is followed by two top events. These are the major points, and they come inside 1.5 year windows in the peaks and troughs of the sine wave cycle.
One interesting example is the failed bull market between 1985 and 1996. The two cycle top events landed in their appropriate places, but the bull market fell flat. The timing structure was still there even though the price advance did not develop in the same way.
This theory joins my Halving Cycles Theory for Bitcoin and Quarter Cent Cycles Theory for the S&P 500. Each studies the recurring timing and structure of its own market.
When I introduced the theory on April 7th, 2026, I considered February 2026 a likely end to the bull market and the beginning of a bearish phase lasting until 2030 or 2031. I also set a clear test: for the theory to remain successful in the near term, the bull market would need to end by July 2027 at the latest, at the end of the 10 to 11 year window.
Read my original explanation on X
Explore the current model collection
Premium members can continue below to the three dedicated Data Library model layouts.