

(Return to Data Library)
My original models
These are the cycle theories and price models at the center of my research. Below, I explain the ideas in my original work alongside updated chart pictures. The working TradingView layouts and their reading guides are in the Premium collection further down the page.
The source links preserve the full context of my original posts, including any projections made at the time. For my current interpretation, read the latest Premium research.
Halving Cycles Theory: Overview
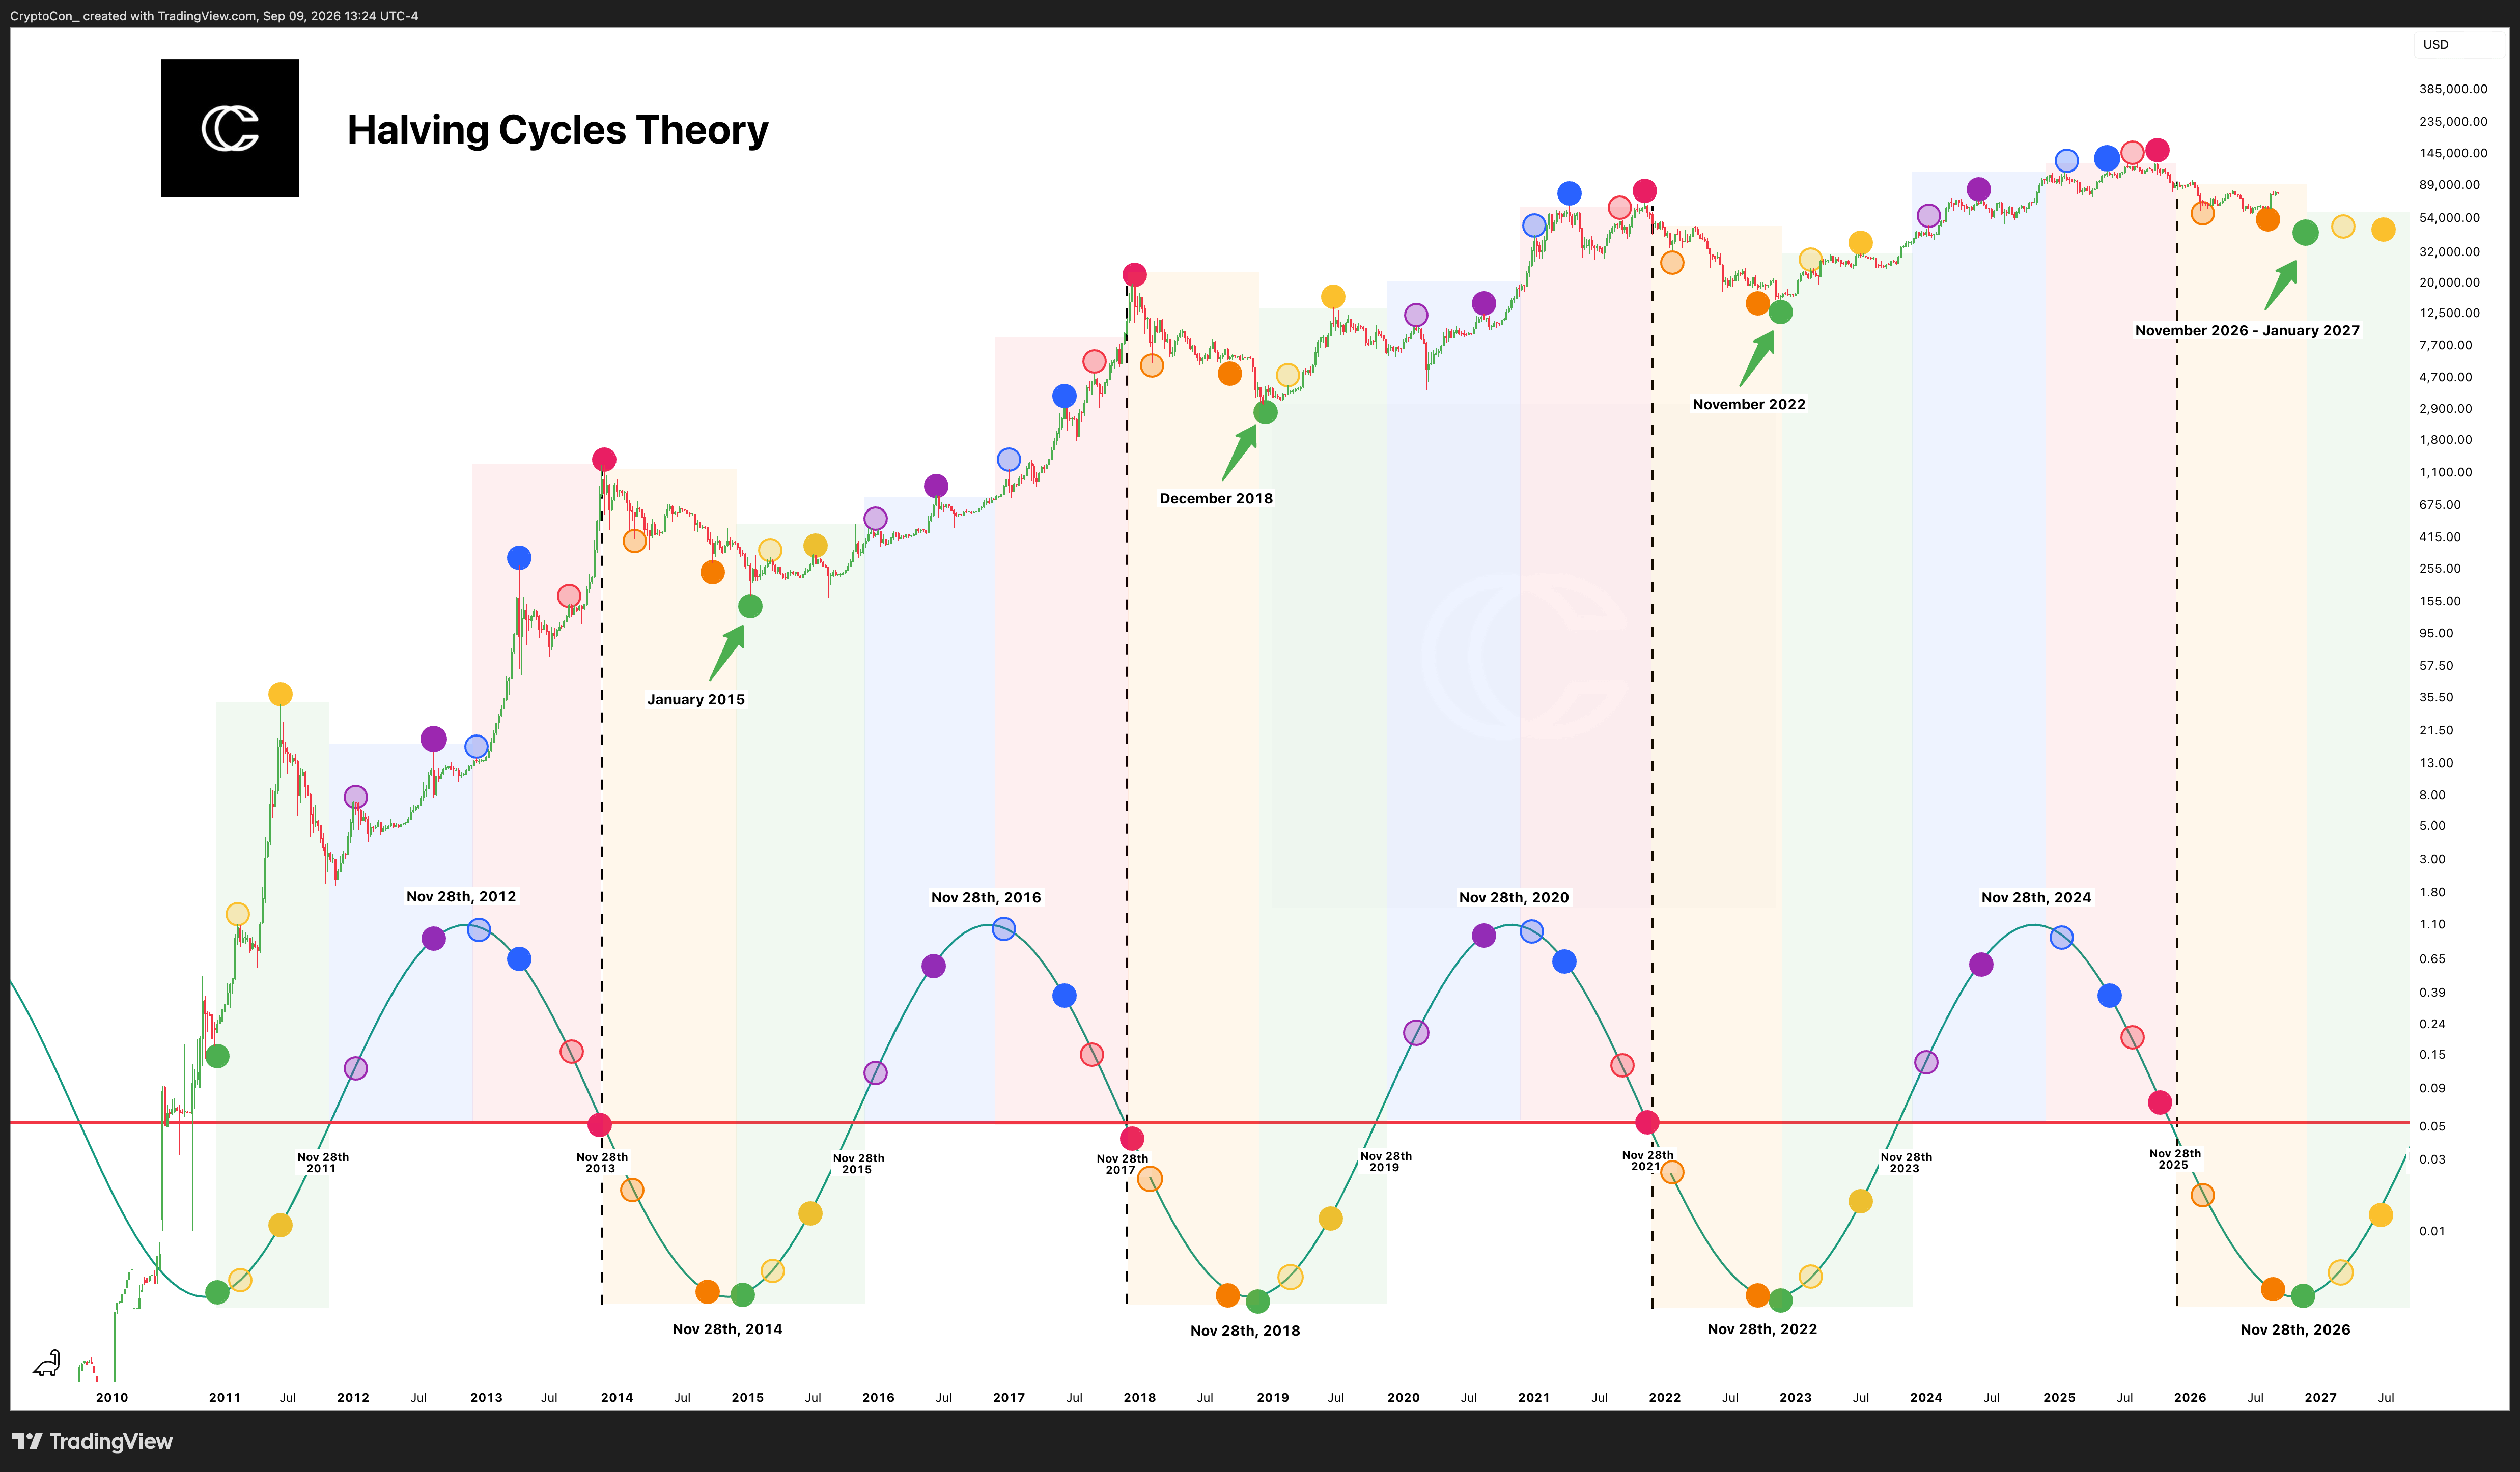
My November 28th Cycles Theory became part of the Halving Cycles Theory when I added the date of the second halving. The model is based around the first halving on November 28th, 2012, and the second on July 9th, 2016. Four year cycles are extracted from November 28th, while July 9th marks milestones inside the cycle.
This is my Bitcoin time model. It follows cycle tops, cycle bottoms, and the first and second early tops. The four colored years describe what I look for at each stage:
Green Year: Accumulation. This is the year of the best cycle buying prices in the original framework. Bitcoin begins at a cycle bottom and advances towards the median price, defined as half the previous all time high. The first early top comes in Green Year, followed by a cool down.
Blue Year: Preparation. Bitcoin establishes time at its new fair value, the median price, then advances to the second early top. Towards the end of this phase, price moves towards new all time highs and the real bull market begins.
Red Year: New All Time Highs. Red Year is the final hurrah for crypto. It contains the last cycle parabola and the search for the cycle top.
Orange Year: Bear Market. After setting its cycle top, Bitcoin must find a new point of undervaluation. The model follows a downtrend towards the next cycle bottom, where the sequence restarts.
In my September 2023 explanation, cycle bottoms were marked by green dots around November 28th at the beginning of Green Year, and cycle tops by red dots around November 28th at the end of Red Year. Yellow and purple dots marked the first and second early tops around July 9th in Green and Blue Year. The original study described an average timing range of roughly 21 days on either side of those dates.
The current chart includes the timing windows developed since that original explanation. I use the sequence to compare what the market is doing with what the cycle calls for, alongside trend, momentum, and valuation data.
Read my original explanation on X
November 28th Cycles Theory: Overview
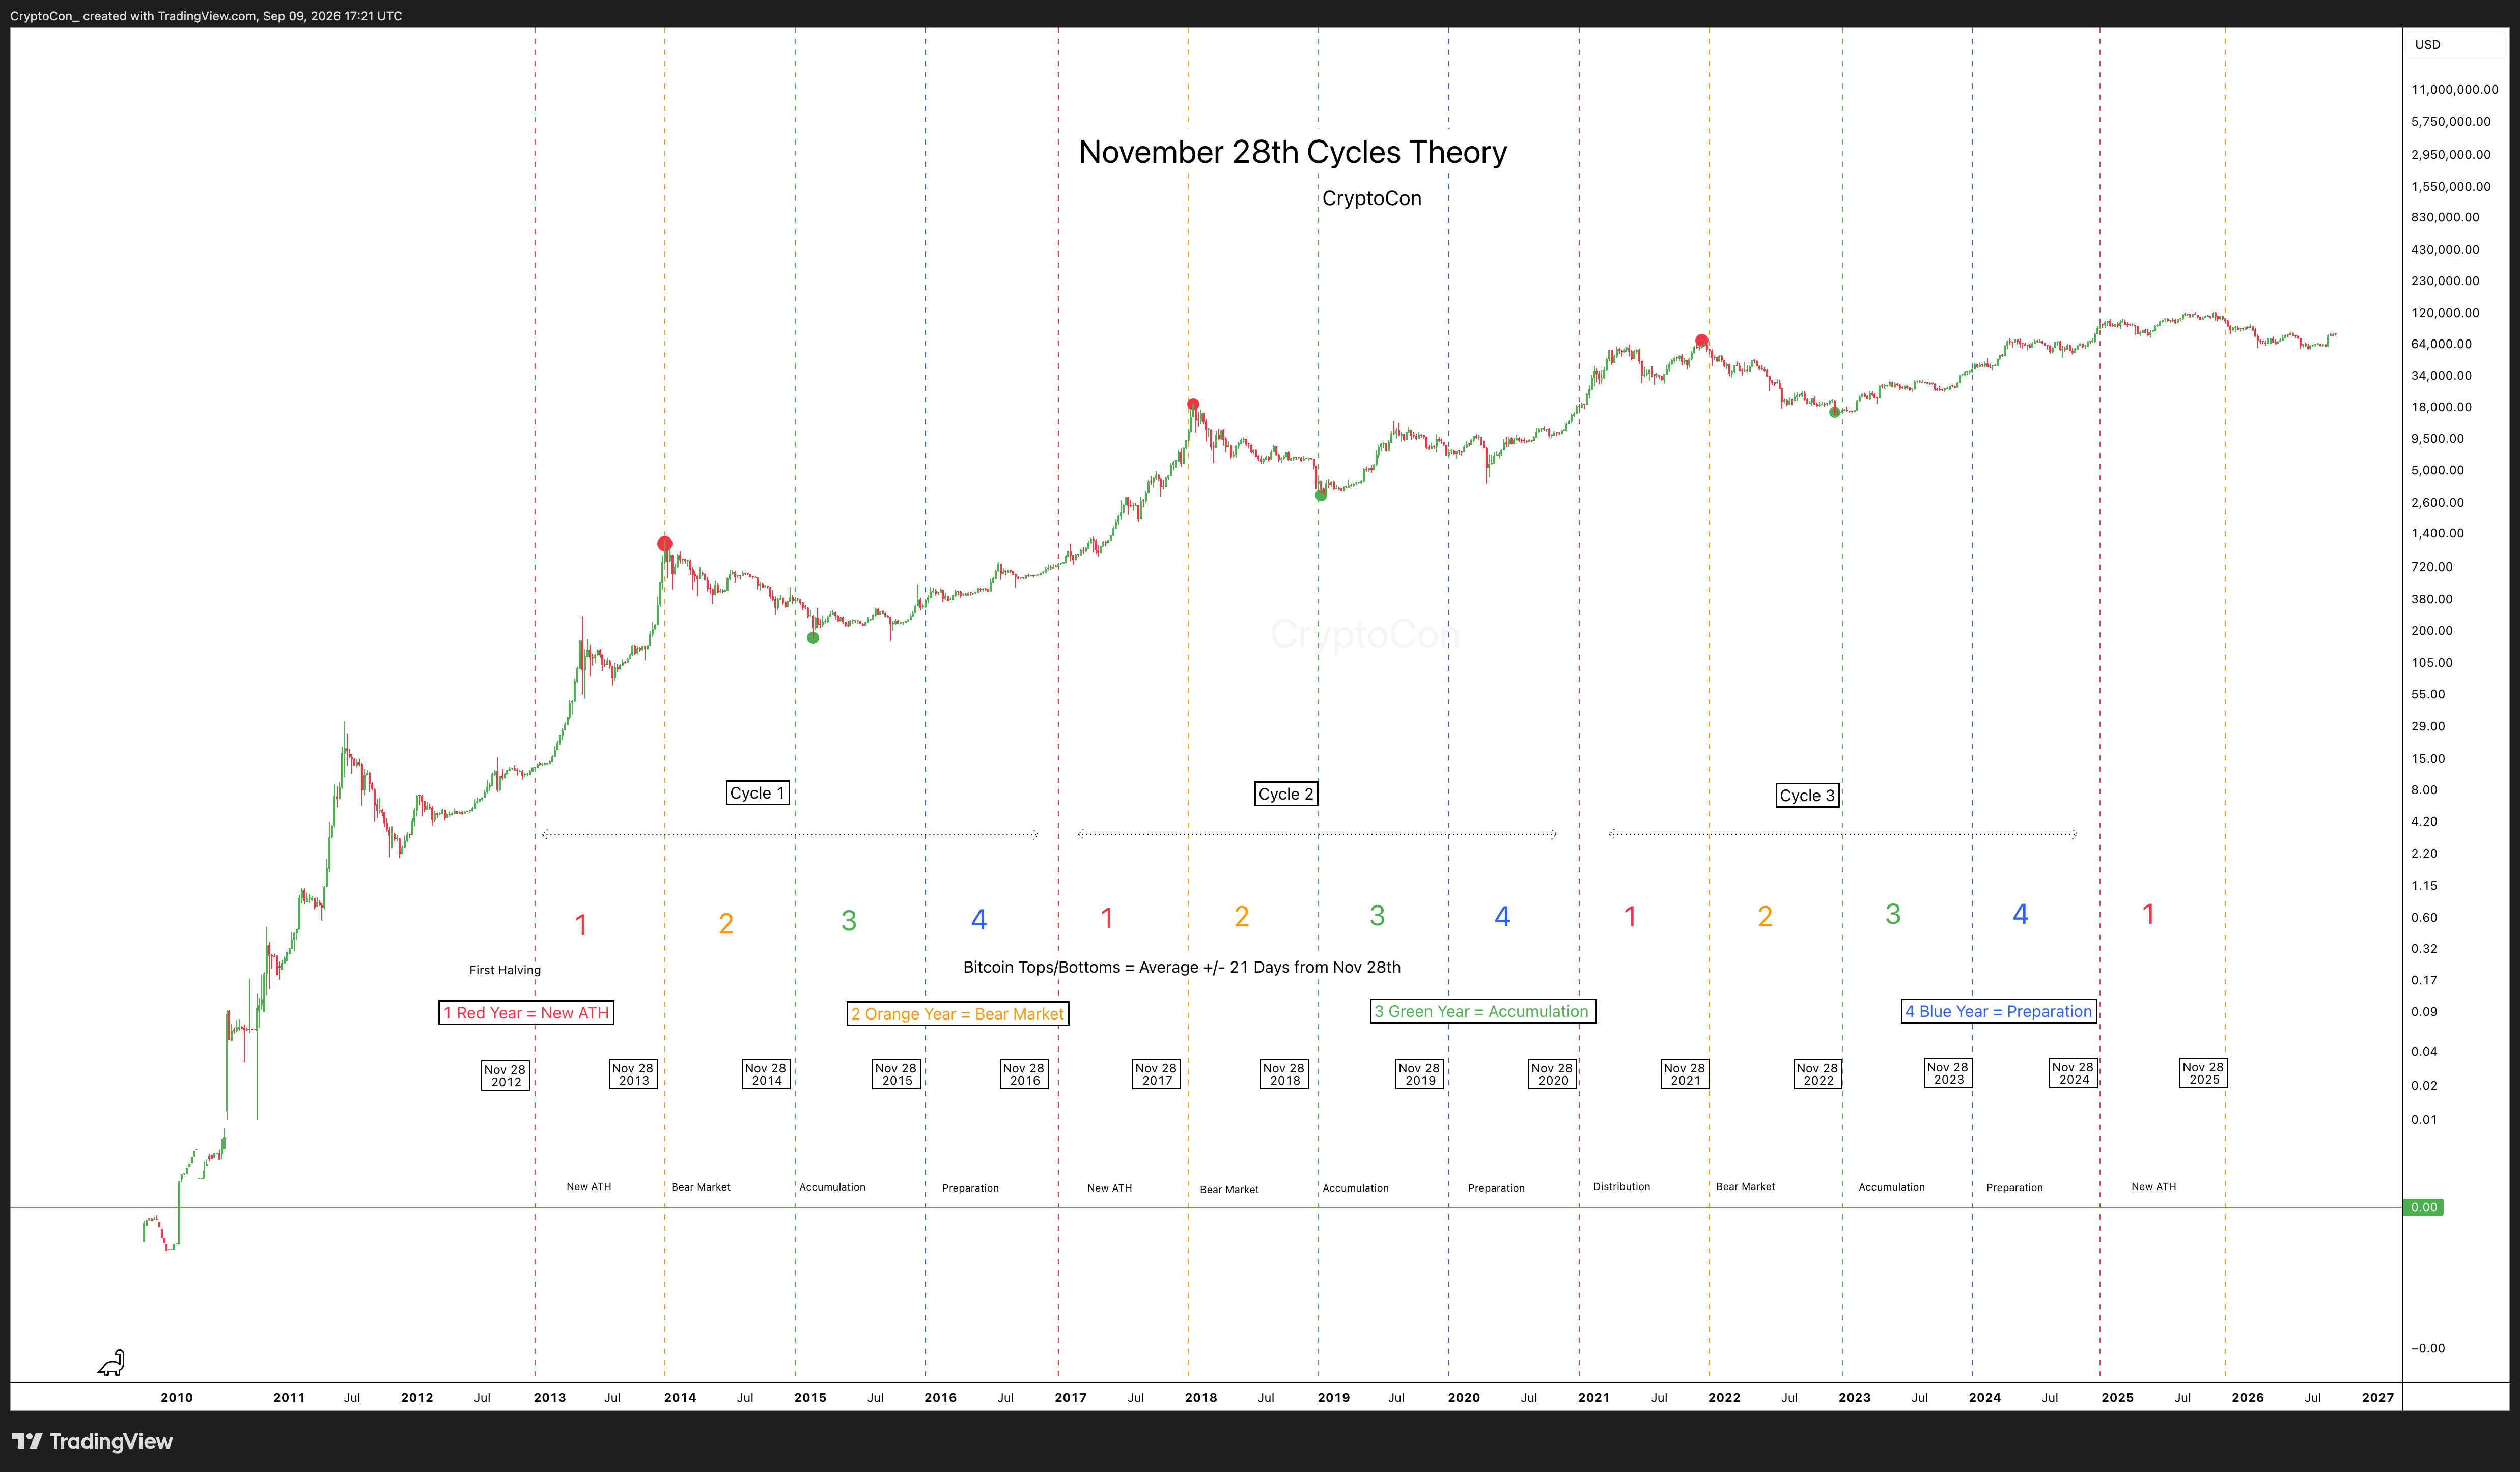
I created the November 28th Cycles Theory in January 2023. It is the backbone of my other Bitcoin time theories and states that Bitcoin is centered around the date of the first halving, November 28th, 2012.
The theory breaks the cycle into four parts. Here is the sequence from my original description:
New All Time Highs: A new all time high will be made in the year.
Bear Market: Bitcoin corrects and forms new bottom prices.
Accumulation: Buying pressure picks up and price returns towards the median price.
Preparation: Preparing for new all time highs.
The other part of the theory is its relationship to major tops and bottoms. My original January 2023 study compared those turning points with November 28th and described an average range of roughly 21 days on either side. It also recorded exceptions, including the January 2015 bottom 47 days after the reference date.
The median price is half the previous all time high. Together, the four phases, the median, and the November 28th reference give me a way to organize where Bitcoin stands in its larger cycle. The Halving Cycles Theory later expanded this original work with July 9th and the early tops.
Magic Bands: Overview
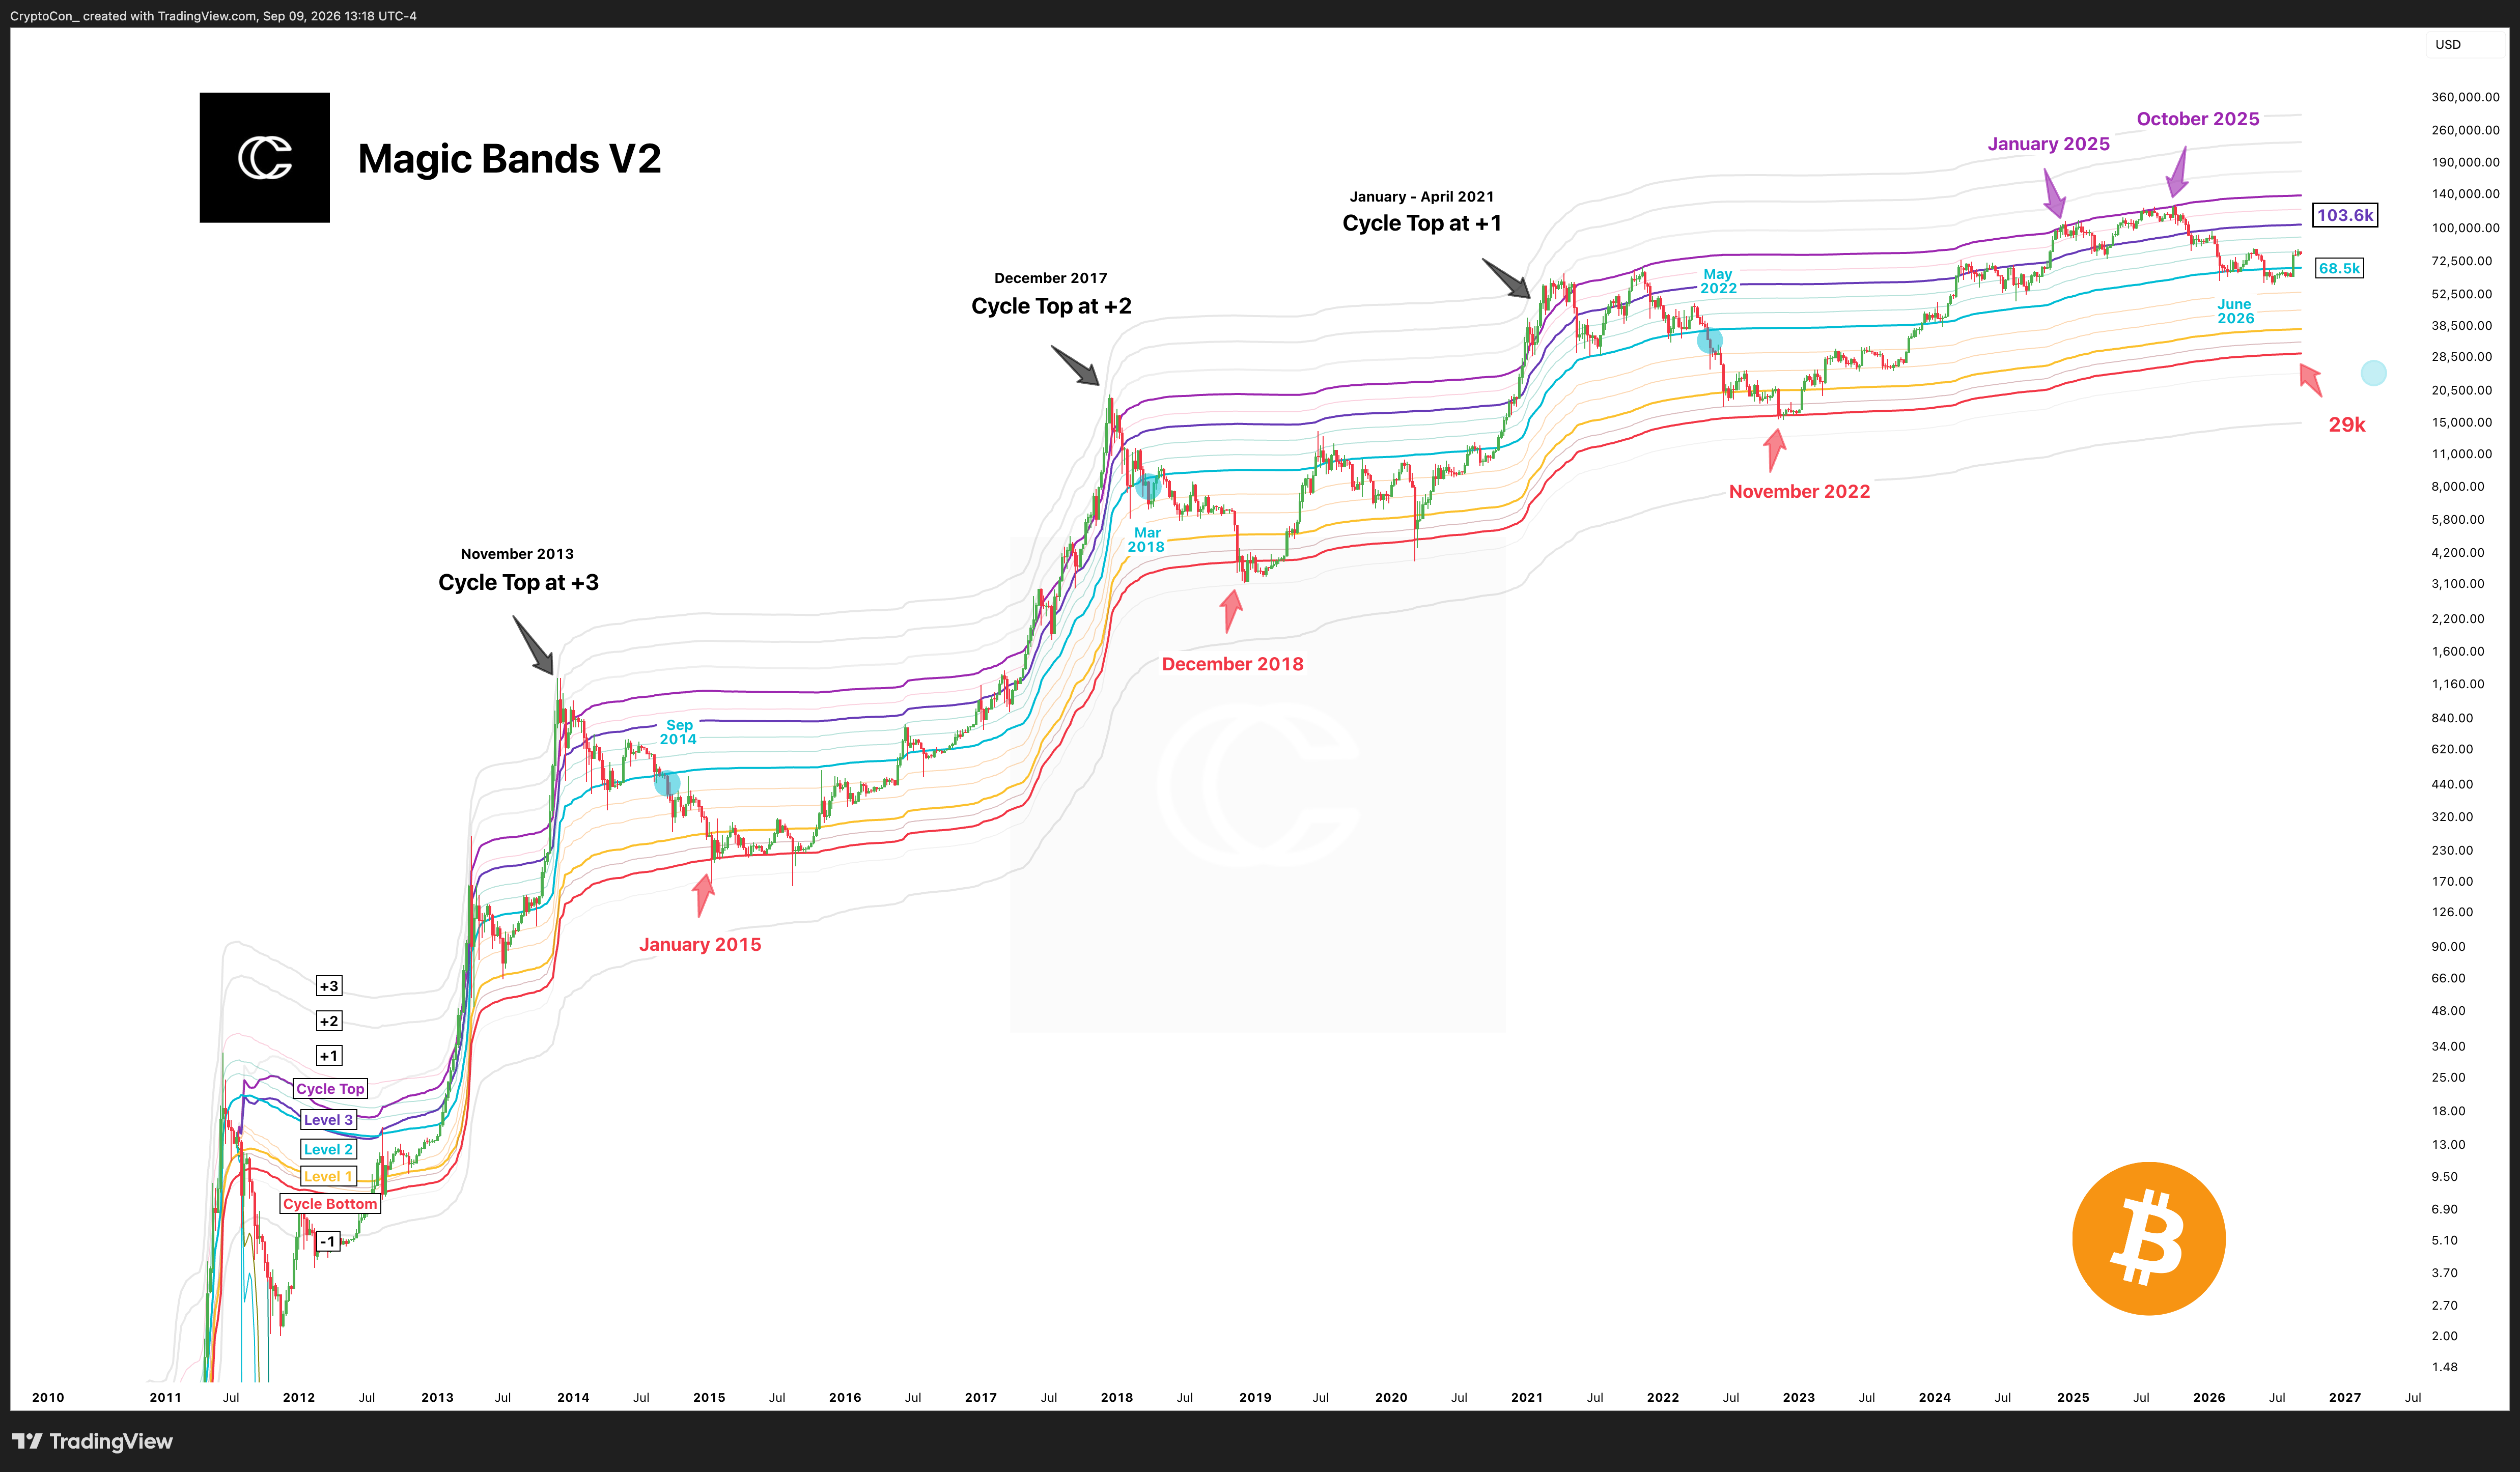
Magic Bands are my own Bitcoin band model. I created them to follow the levels respected by major local tops and bottoms, as well as the larger cycle highs and lows.
The primary levels are the main reference points, with secondary levels in between. In my original explanation, I described primary levels as acting like magnets: price did not like to stay between them. Level 1 had been stiff resistance in each cycle, and breaking through it had been followed by a move towards Level 3.
The model also tracks progressing bottom levels. In the October 2023 introduction, I showed how those levels lined up with the three previous cycle bottoms, and how the upper bands came close to earlier cycle tops. The topmost band expands at a decreasing rate.
The current Magic Bands V2 chart follows the same central idea through the Cycle Bottom band, Levels 1, 2, and 3, the Cycle Top band, and extensions. The question is how price reacts as it approaches, rejects, or breaks through each level.
The $48,000 next level and $130,000 cycle target discussed in my October 29th, 2023 post belong to that historical setup. The bands move over time, so the updated chart provides the relevant levels for the period being studied.
Read my original explanation on X
Log Growth Curves Extended: Overview
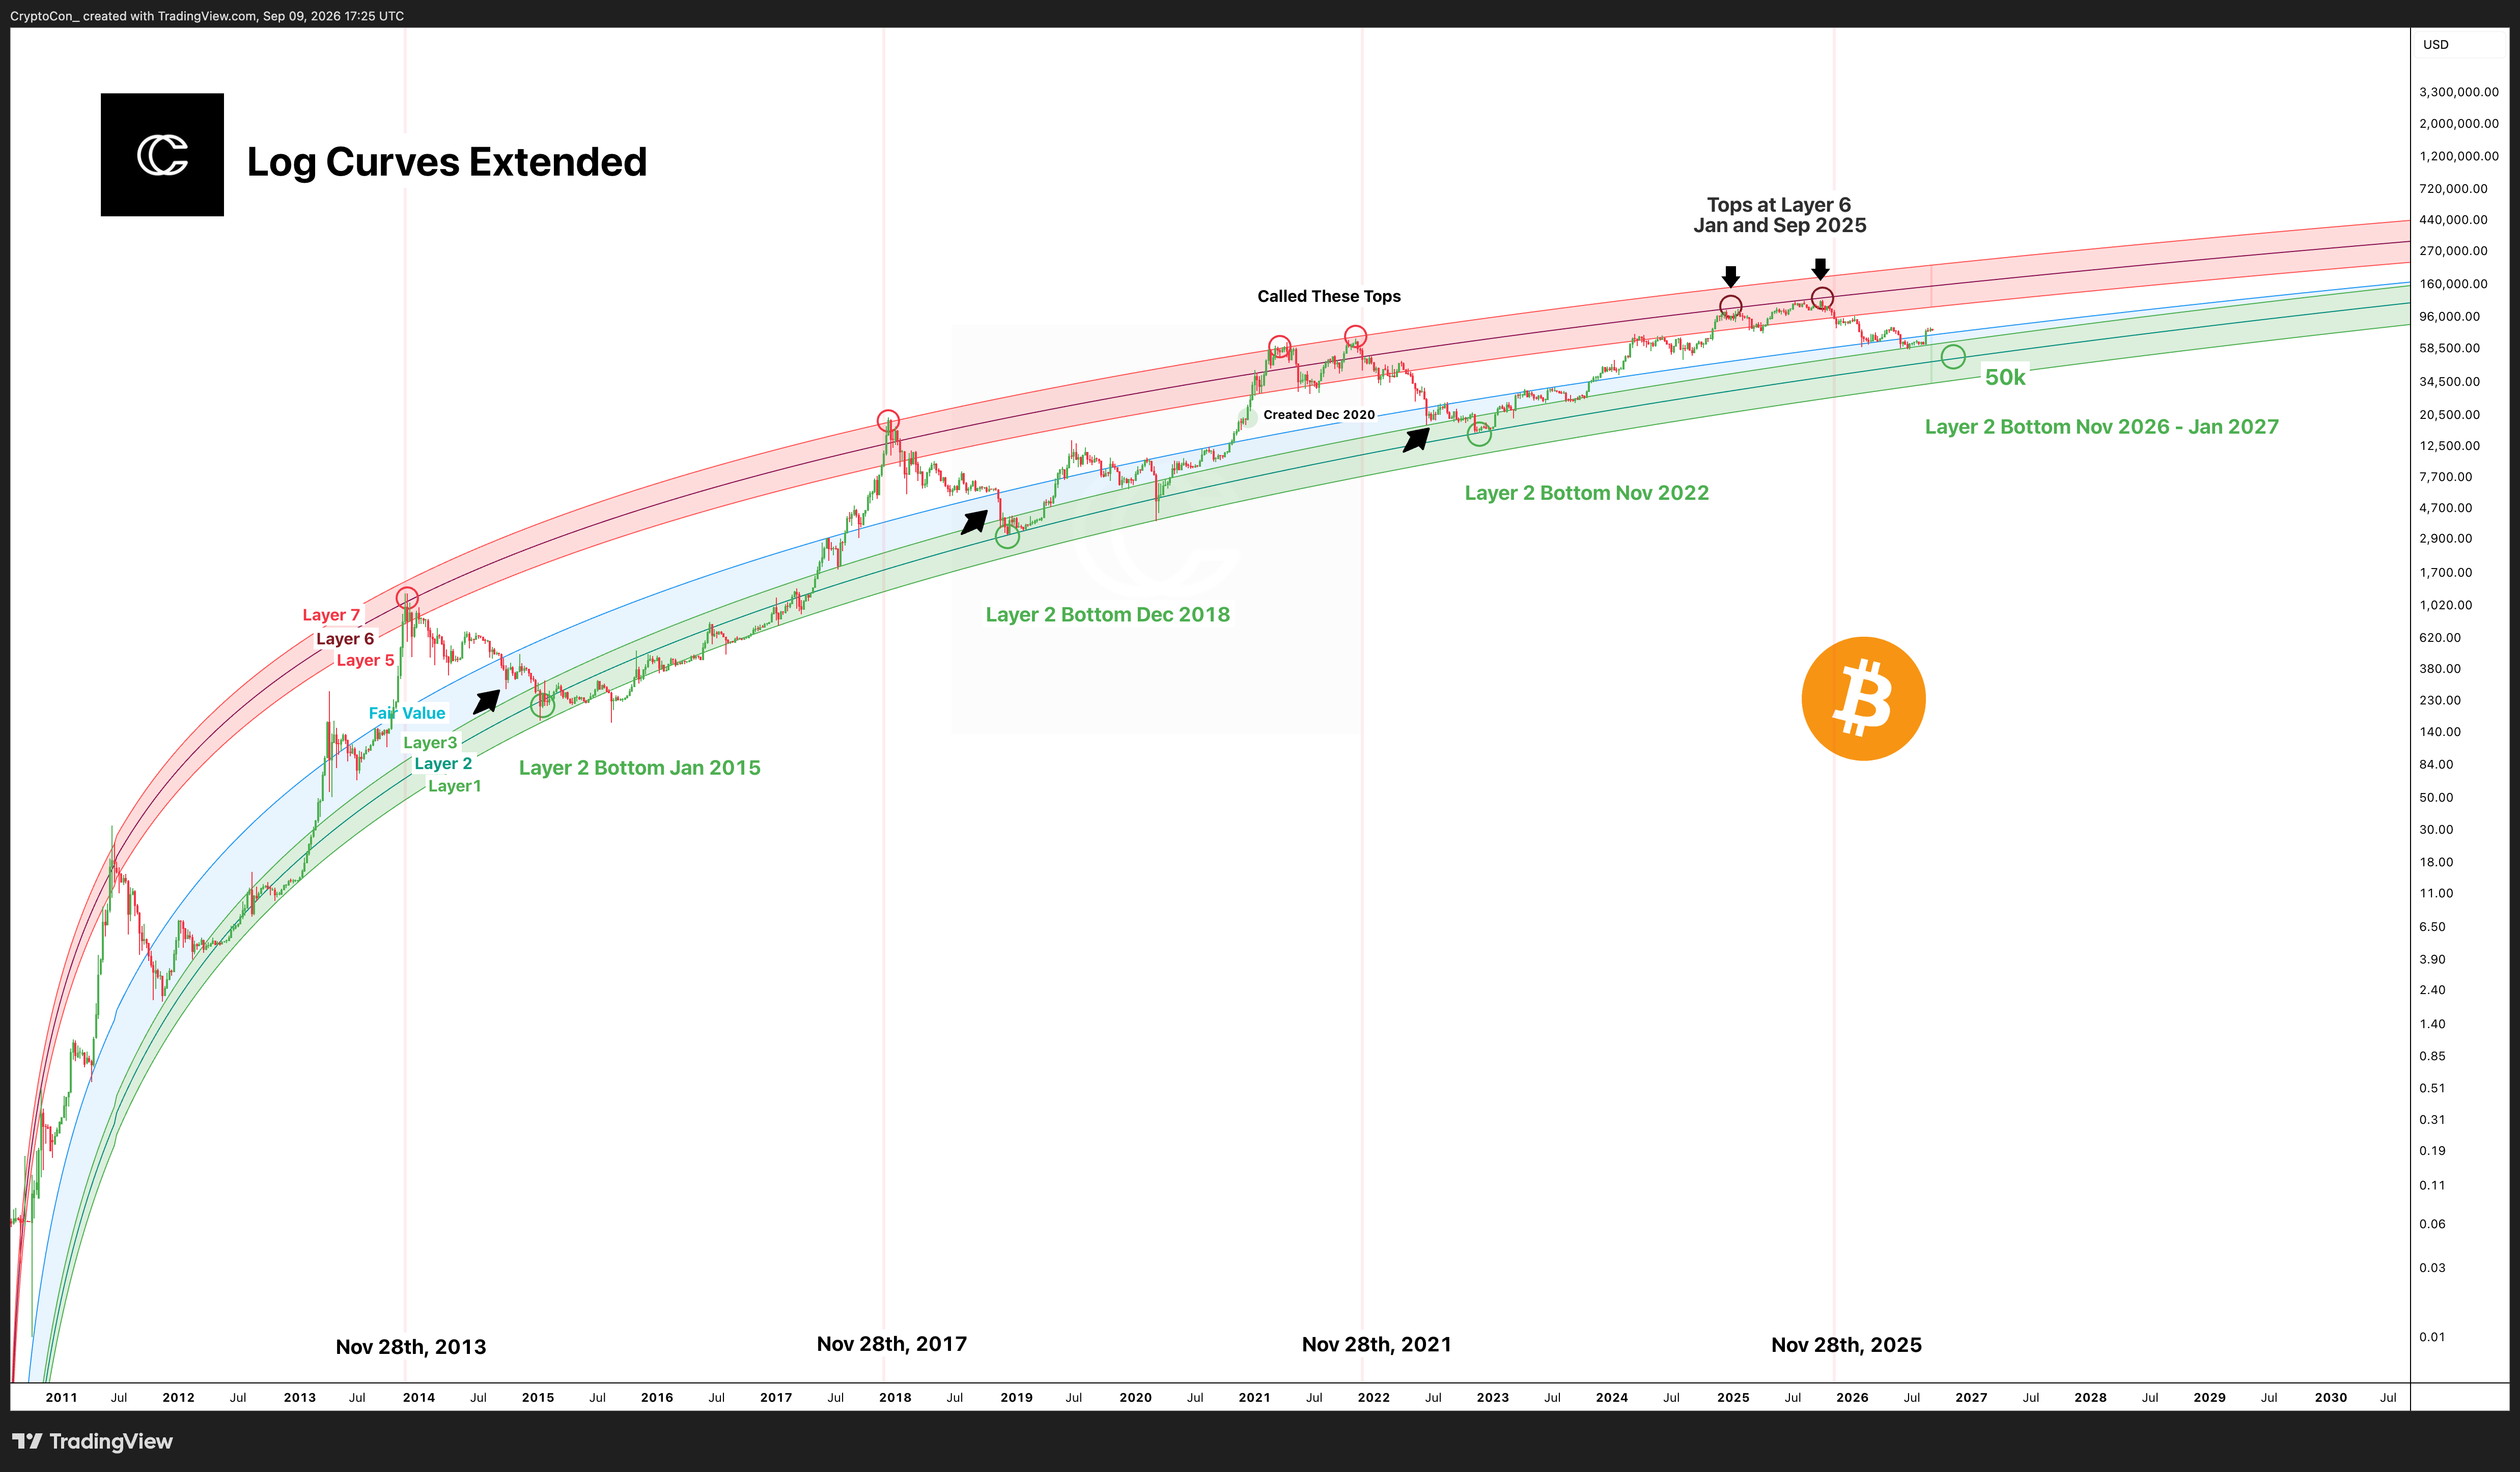
My Log Growth Curves Extended model places Bitcoin within a family of long term logarithmic curves. The chart has three green lower layers, a blue Fair Value curve, and three red upper layers. They give me a way to compare undervaluation, fair value, and price extension through Bitcoin’s history.
The upper layers are numbered 5, 6, and 7. I compare the layers reached at different cycle highs, rather than assuming every top has to reach Layer 7. The lower layers provide the corresponding reference for the deep corrections and lower valuations of the cycle.
The extended model preserves the original curves as they move into the future. Each layer follows its original path until it naturally reaches Fair Value; from that point it follows Fair Value. The layers do not disappear at an arbitrary date, and Fair Value itself keeps its original path.
This makes the longer view useful for studying diminishing returns and the narrowing distance between the model’s levels as Bitcoin matures. The curves describe the model’s price paths, while the market still determines which levels are reached.
Explore the current model collection
Premium members can continue below to seven model layouts, including the Fibonacci and Business Cycle variations of the Halving Cycles Theory and Diminishing Golden Curves.
See everything included with Premium
For S&P 500, gold, and Treasury yield models, see Stocks Models.